How are our Schools Funded?

In order to effectively fight for the education our children deserve, we need to understand the basics of the Philadelphia School District (SDP) 3.2 billion dollar budget. (Fiscal Year 2019). This includes knowing where the money comes from and where it flows to. Let’s start with the source of funds. This graphic, pulled from the School District website (FY 2019 Budget 101) shows the breakdown of funding sources.
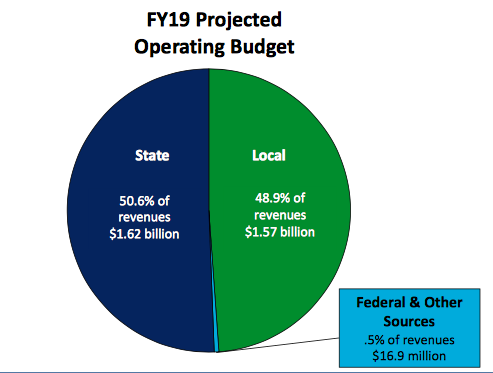
As seen in this figure, there is currently an almost even split between state and local money. This wasn’t always the case. Five years ago, the 2013/2014 budget split was around 58% from the state and 42% from the city (Source: SDP FY 15 Consolidated Budget) Five years before that, the 2008/2009 budget split was 64% from the state and 36% from the city (Source: The FY 12 Proposed Budget Briefing for City Council.) You could write many pages about how the revenue streams have fluctuated over years, but we have much more to cover.
First, we need to understand the 1.57 billion dollars that the city contributes. According to the school district budget summary, about 56% of this money comes from real estate taxes and the other 44% of local revenues come from other taxes and fees. The following detailed breakdown is from the district’s own Budget 101 presentation.

The real estate tax (also know as the property tax) is by far the largest portion of local revenue. According to the City of Philadelphia’s website around 54% of the total property tax goes to the School District. Knowing the property tax is the largest City revenue producer for the school district is the key to understanding why tax abatements for new construction are taking away an important direct revenue stream for our schools.
What about those other City sources? The School District of Philadelphia receives $120 million each year from the extra 2% sales tax in Philadelphia (in addition to the 6% that goes to the State.) Also, based on the FY 19 consolidated budget report, it appears that the entire 1.21% Business Use and Occupancy Tax goes to our schools.
The City Grant is an amount granted by the City Council during the budget vote. The School District also receives $58 million annually from the Cigarette Tax. In addition, the “Other” category, at around $157 million, includes gaming revenue and the Parking Authority contribution, and payments in lieu of taxes (PILOTs) for the sports stadiums.
Now that we understand the basics of the local revenue sources, we need to understand the State’s contribution. The pie chart below is again straight from the district’s Budget 101 presentation.

As you can see, the Basic Education Subsidy is the major component of our state funding. One could write multiple blog posts on the unfairness of Pennsylvania’s distribution of State funds for education, but we will just leave you with this article link instead. And maybe this one, too. The State also includes money specifically for Special Education and Transporting students to and from school. Retirement reimbursements cover the State’s portion (50%) of the pensions for teachers hired before 1994. (For teachers hired later, the state doesn’t contribute at all to their pension funds.) “Other” for the State includes payments into Social Security and School Health funds.
Also, not included in the districts summary of revenue, the district receives many large grants for programs such as Title I and Head Start totalling around $467 million. While $3.2 billion may seems like a lot of money coming in, we really need to dive into all the places it’s going and stretching in order to understand why 3.2 billion is still not enough. Tune into our next post for that discussion.